IHUB
IHUB
 Private Briefings (Webinars)


 LeaderSpeak Podcast
  Global Entertainment Digest (Newsletter)
  Premium Lists
 Membership Benefits
 About Vitrina
 Our Story
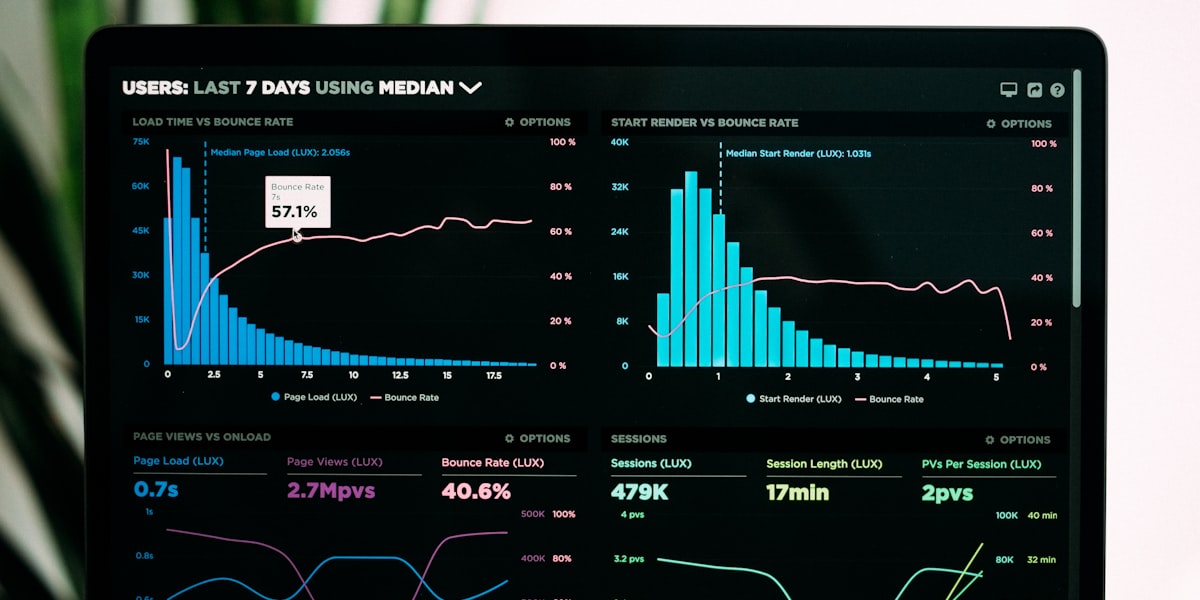
Behind every accurate answer that VIQI delivers is a data infrastructure that took years to build. The entertainment industry does not have a central public registry of companies, deals, or decision-makers. Trade press captures a fraction of activity. Regulatory filings vary by territory. Company websites go stale within months of a leadership change.
Vitrina solved this by building its own entertainment industry data graph — a structured, verified, continuously maintained dataset of M&E companies and the relationships between them. This article explains what that graph contains, how it is built and verified, and why verified data provenance is the critical differentiator between VIQI and any other AI tool claiming to serve the entertainment market.
- Vitrina’s entertainment data graph covers 300,000+ verified M&E companies across 100+ territories
- The graph includes production companies, broadcasters, streamers, distributors, financiers, talent agencies, and post-production companies
- Data is verified through licensed partnerships, structured outreach, and rolling re-verification — not passive web scraping
- Scraped and AI-hallucinated data cannot reliably serve business decisions in a fast-moving deal environment
- VIQI queries the verified graph directly, not the open web — which is why its answers are reliable for commercial use
What Is an Entertainment Industry Data Graph?
A data graph, in the technical sense, is a structured dataset that represents entities (companies, people, projects, deals) and the relationships between them. An entertainment industry data graph maps M&E companies as nodes, and the commercial relationships between them — co-production agreements, financing arrangements, distribution deals, talent contracts — as edges.
The advantage of a graph structure over a flat database is that it supports multi-hop queries: not just “what companies are in this territory?” but “which production companies have co-produced with European broadcasters and also secured gap financing from UK-based lenders?” These are the kinds of compound queries that entertainment BD and acquisitions professionals need answered daily.
Building a reliable entertainment data graph requires solving a uniquely difficult data problem: most of the commercially valuable relationships in the M&E industry are never publicly documented. A co-production agreement between a UK indie studio and a Nordic broadcaster may never appear in trade press — but it is exactly the kind of signal a distribution company needs when evaluating potential partners in that territory.
The Scale of Vitrina’s Entertainment Data Graph
Vitrina’s entertainment data graph is the largest verified M&E company dataset of its kind. The graph covers:
The company types covered by Vitrina’s verified entertainment data graph include:
- Production companies — scripted, unscripted, animation, documentary, features, and episodic TV
- Broadcasters — terrestrial, cable, satellite, and regional public broadcasters
- Streaming platforms — global SVODs, AVODs, local streamers, and niche platforms
- Distributors and sales agents — international and territorial
- Co-financing and gap financiers — banks, funds, tax incentive bodies, and private equity
- Talent agencies and management companies
- Post-production and VFX houses
- Music and licensing companies
The geographic coverage spans major production markets (US, UK, France, Germany, India, Japan, South Korea, Australia) and emerging territories across LATAM, MENA, Southeast Asia, and Eastern Europe — giving VIQI the territorial breadth that global M&E professionals require. Explore the full product at vitrina.ai/viqi/.
Access 300,000+ Verified M&E Companies via VIQI
VIQI gives you direct query access to Vitrina’s entertainment data graph — covering production companies, buyers, financiers, distributors, and decision-makers across 100+ territories.
How Vitrina Verifies Its Entertainment Data
Vitrina’s data verification process is a core part of what makes the entertainment data graph commercially reliable. Data verification happens at three levels:
Level 1 — Source Intake
Vitrina ingests data from a combination of licensed data partnerships, trade publications, regulatory and industry filings, and structured company submissions. Each source is categorised by reliability tier — licensed data partnerships and regulatory filings are weighted more heavily than trade press reports, which in turn outrank passive web data.
Level 2 — Structured Verification
High-priority data points — particularly contacts, deal relationships, and financial structures — are subject to structured verification through direct company outreach. This is where Vitrina’s data graph diverges fundamentally from scraped databases: a company’s head of acquisitions is verified by contact, not inferred from a LinkedIn scrape.
Level 3 — Rolling Re-Verification
The entertainment industry changes rapidly. Companies are acquired, rebranded, or restructured. Decision-makers move between companies. Mandates shift with strategy. Vitrina’s data graph is maintained through a rolling re-verification cycle that prioritises the most commercially active companies — those with recent deal activity, active production slates, or significant changes in ownership or leadership.
This three-level approach is why VIQI’s answers can be used for actual business decisions — sourcing a co-producer, approaching a financier, or identifying a buyer — rather than just background reading. Review how this compares to generic AI tools for entertainment research.
Why Scraped and AI-Generated Data Fails Entertainment Professionals
The alternative to a verified entertainment data graph is scraped data — assembled from publicly available websites, press releases, LinkedIn profiles, and trade news. Scraped data has several fundamental problems for professional M&E use:
VIQI: Querying the Verified Graph in Real Time
As an AI agent, VIQI’s function is to translate natural-language queries from M&E professionals into structured lookups against Vitrina’s verified entertainment data graph. The graph provides the data; VIQI provides the interface.
This architecture has three important consequences:
- No hallucination on company data — VIQI answers questions about companies, contacts, and deals from verified records, not inferred from training data
- Current data — VIQI reflects the most recent state of the verified graph, not a training snapshot from a fixed cut-off date
- Provenance-aware outputs — users can understand the basis for each data point, including when it was last verified
This is what makes VIQI a genuine intelligence tool rather than a sophisticated search interface: the quality guarantee comes from the data, not from the language model. Understanding what VIQI is starts with understanding the data graph it runs on.
Query Vitrina’s Verified Entertainment Graph
VIQI gives you direct access to verified M&E company data — no hallucinations, no scraped stale contacts, no fabricated deal credits. Real intelligence from a verified source.
How the Data Graph Serves Different Entertainment Roles
The verified entertainment data graph is the underlying asset. How it creates value differs by role:
| Role | Key Data Need | What VIQI Surfaces |
|---|---|---|
| Producers | Co-production partners, financiers | Verified companies with matching genre, territory, and recent co-production history. See finding co-production partners. |
| Buyers | Active sellers, deal patterns | Verified seller profiles with current slate, format history, and acquisition track record |
| Distribution | Buyer contacts, platform mandates | Verified buyer decision-makers, acquisition history by genre and territory |
| Financiers | Capital stack patterns, lender activity | Real financing structures for comparable productions. Explore film financing options. |
| Strategy Teams | Competitor activity, market signals | Competitor deal flow, slate changes, partnership announcements from verified sources |
Vitrina’s Role as M&E Data Infrastructure
Vitrina began as a structured data company for the entertainment industry — building the verified graph long before VIQI made it accessible through an AI interface. The investment in data infrastructure came first; the AI agent capability is built on top of it.
This sequencing matters. Vitrina’s entertainment data graph is not a byproduct of training a language model on entertainment websites. It is a deliberately curated dataset built through years of structured sourcing, licensing, and verification — the kind of data asset that cannot be replicated quickly by a competitor with a better AI model but without the underlying data.
As the M&E industry continues to digitise its commercial operations — from deal sourcing to partner matching to market monitoring — the companies with access to verified, structured data will consistently outperform those relying on press monitoring, conference networks, and general-purpose AI. Vitrina’s role is to make that data infrastructure available through VIQI at the scale individual teams and enterprise buyers need.
To understand how this data infrastructure supports specific research tasks, see how content licensing trends are tracked across Vitrina’s verified company relationships.
Conclusion
The quality of any AI-driven intelligence tool depends entirely on the quality of the data underneath it. Vitrina’s entertainment industry data graph — 300,000+ verified M&E companies across 100+ territories — is the infrastructure that makes VIQI’s answers commercially reliable. Verified data provenance, rolling re-verification, and structured relationship mapping are not optional features; they are the entire basis of the value proposition.
For entertainment professionals evaluating AI tools for deal research, company intelligence, and market monitoring, the right question to ask of any vendor is not “which AI model do you use?” — it is “where does your data come from, and how is it verified?” The answer to that question determines whether the tool is a genuine intelligence asset or an expensive hallucination risk.
Try VIQI — Built on the Industry’s Largest Verified M&E Graph
300,000+ verified entertainment companies. Real deal intelligence. No hallucinations. Start your free trial and see the difference verified data makes.